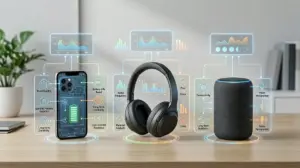
A quality perception tool measures how customers, users, or buyers interpret the quality of a product, service, brand, or experience. It helps teams move beyond internal assumptions and see whether the market reads an offer as premium, reliable, cheap, innovative, inconsistent, or worth the price. In practical terms, it is used to collect structured feedback on quality signals such as design, durability, ease of use, trust, support, packaging, pricing, and overall value.
What a quality perception tool does
The main job of a quality perception tool is to turn subjective impressions into usable decision data. Instead of asking only whether people like a product, it asks how they judge its quality and why. That matters because buyers often make decisions based on perceived quality before they can verify actual performance.
Most quality perception tools combine several inputs:
- Customer surveys with rating scales
- Review analysis from marketplaces and software directories
- Brand comparison questions against direct competitors
- Attribute scoring for areas such as reliability, finish, support, and value
- Open-text feedback that explains what creates a high- or low-quality impression
For buyers and comparison teams, the tool is useful because it shows whether a product wins on genuine confidence factors or just on price and visibility. For brands, it highlights where quality is being communicated well and where it is being lost in the buying journey.
When to use a quality perception tool
Use a quality perception tool when you need to understand why buyers rate one option above another, especially in crowded categories where products look similar on paper. It is particularly valuable before a launch, after a redesign, during a rebrand, after a wave of negative reviews, or when conversion rates are weaker than expected despite solid product specs.
Best-fit use cases
A quality perception tool is most useful in these situations:
- Comparing your product against two to five close competitors
- Testing whether a higher price is supported by stronger quality signals
- Finding out why review scores are lower than expected
- Checking whether packaging, UI, onboarding, or support is damaging perceived quality
- Validating premium positioning before increasing spend on ads or sales
What to measure inside the tool
The strongest quality perception tools do not rely on one overall score. They break quality into measurable components so you can see what is helping or hurting the final impression.
Core quality perception metrics
Look for a tool or framework that measures:
- Overall perceived quality: how good the product feels relative to expectations
- Reliability perception: whether buyers expect consistent performance
- Value for money: whether quality feels fair for the price
- Design and presentation: visual polish, packaging, interface, and finish
- Trust and credibility: confidence in the brand, claims, and support
- Comparison strength: how quality is judged against named alternatives
- Intent impact: whether perceived quality increases likelihood to buy, renew, or recommend
If you are evaluating software, add usability, implementation quality, support responsiveness, and feature stability. If you are reviewing physical products, add materials, durability, packaging, and defect expectations.
How to compare quality perception across products or brands
For comparison-led buying decisions, the tool should show more than averages. It should reveal where one option leads and where another creates friction. A product may score high on design but low on trust. Another may feel dependable but outdated. Those differences are often what decide shortlist winners.
What a useful comparison view should include
A practical comparison setup should show:
- Average rating by quality attribute
- Percentage of respondents calling the product premium, reliable, or good value
- Review sentiment split by positive, neutral, and negative quality mentions
- Top reasons for low-quality perception
- Top reasons buyers choose a competitor instead
This is where review platforms and internal survey tools often differ. Review platforms are strong for public sentiment and competitor context. Internal survey tools are better for controlled testing, segmented analysis, and pre-launch decisions. The best choice depends on whether you need market proof, internal diagnostics, or both.
How buyers can use quality perception data
If you are comparing products, software, tools, or services, quality perception data helps you avoid a common mistake: choosing based only on features. Two options can look similar in a spec table but perform very differently in real use because one feels more stable, better supported, or more trustworthy.
Use quality perception findings to check:
- Whether high ratings are backed by consistent quality comments
- Whether low-priced options are seen as poor value after setup or support issues
- Whether premium options justify cost through reliability and satisfaction
- Whether negative quality comments are isolated or repeated across reviewers
Short workflow example
A software team notices that trial sign-ups are healthy but paid conversion is weak. They run a quality perception study across current users, churned users, and prospects comparing their product with three competitors. Results show strong feature ratings but low scores for onboarding quality, support confidence, and interface polish. Review analysis confirms repeated complaints about setup friction. The team updates onboarding, improves help coverage, and refreshes key screens. In the next measurement cycle, perceived quality rises, competitor preference drops, and paid conversion improves.
How to choose the right quality perception tool
The right tool depends on whether you are making a buying decision, auditing a brand, or improving a product. A lightweight survey platform may be enough for a small comparison project. A more advanced research or review analytics tool is better if you need competitor benchmarking, sentiment tagging, segmentation, and trend tracking over time.
What to look for before you buy
Prioritize tools that offer:
- Custom quality attributes instead of one generic satisfaction score
- Competitor comparison in the same study
- Easy export of ratings, comments, and sentiment themes
- Segment filters by customer type, use case, or price tier
- Clear reporting that links perception to buying intent
Avoid tools that only produce vanity scores without showing what is driving them. If the output does not explain why quality feels high or low, it will be hard to act on.
Common pros and cons
Pros
- Turns subjective quality impressions into comparable data
- Helps explain weak conversion, low ratings, or price resistance
- Makes competitor comparisons more practical and evidence-based
- Highlights the exact touchpoints shaping buyer confidence
Cons
- Results can be skewed by brand familiarity or recent experiences
- Bad survey design can confuse quality with general satisfaction
- Small sample sizes may overstate isolated complaints
- Public review data alone may miss silent but important user segments
FAQ
Is a quality perception tool the same as a customer satisfaction tool?
No. Satisfaction measures how happy users are after an experience. Quality perception focuses on how good, reliable, and credible the offer seems, often before or during the buying decision.
Can small businesses use a quality perception tool?
Yes. Even a simple survey and review analysis setup can reveal whether buyers see your offer as trustworthy, well-made, and worth the price compared with alternatives.
What is the difference between perceived quality and actual quality?
Actual quality is the real performance of the product or service. Perceived quality is how buyers interpret that quality based on signals such as design, reviews, support, branding, and past experience.
How often should quality perception be measured?
Measure it before major launches, after significant product or brand changes, and at regular intervals if you compete in a fast-moving category where reviews and buyer expectations shift quickly.